Open Journal of Chemistry
Pulsed galvanostatic electrodeposition of tellurium nanostructures on stainless steel from copper anode slimes plating bath: Effect of pulse parameters
Mazyar Abolfathi1, Taher Yousefi2*, Mohammad Hassan Mallah2, Abbas Rashidi1 and Hamid Reza Moazami2
2Nuclear Fuel Cycle Research School, Nuclear Science and Technology Research Institute, P.O. Box: 11365-8486, Tehran, Iran
Cite this as
Abolfathi M, Yousefi T, Mallah MH, Rashidi A, Moazami HR (2024) Pulsed galvanostatic electrodeposition of tellurium nanostructures on stainless steel from copper anode slimes plating bath: Effect of pulse parameters. Open Journal of Chemistry 10(1): 058-066. DOI: 10.17352/ojc.000040Copyright
© 2024 Abolfathi M, et al. This is an open-access article distributed under the terms of the Creative Commons Attribution License, which permits unrestricted use, distribution, and reproduction in any medium, provided the original author and source are credited.The electrochemical behavior of Te in alkaline media was determined by cyclic voltammetry and linear sweep voltammetry measurements. It indicated that TeO32− ion was first reduced to Te(s), then to Te22− ion. For the first time, the pulsed electrodeposition of tellurium on stainless steel has been studied in an alkaline bath and the effect of duty cycle, frequency, and current density on current efficiencies and morphology were indicated at room temperature. Pulse duty cycles ranging from 10 to 75%, frequencies ranging from 10 to 100 Hz, and current densities ranging from 7.5 to 30 mA/cm2 were employed. The morphology of the electrodeposition of tellurium samples was characterized by SEM. The results showed that due to increasing side reactions at higher current density, the current efficiency decreased with increasing current density. The results of Scanning Electron Microscopy (SEM) cleared that more compact structures with lower porosity were observed for the electrodeposits at lower current densities and less compact samples were obtained at higher current densities. It has been found that the current efficiency of tellurium plating decreases as the pulse duty cycle increases from 10% to 75%. Maximum current efficiency has been observed at 10% duty cycle. The study of the effect of duty cycle on morphology showed that the samples synthesized at a duty cycle of 10% and 25% have approximately similar appearance and particle size. With more increasing of duty cycles to 50 and 75% due to increasing hydrogen evolution rate and H2 bubbling at the electrode surface the morphology has been changed remarkably. The current efficiency of the deposit tellurium exhibited a strong dependence on the frequency. As frequency increases, the current efficiency almost decreases. In most cases, the maximum current efficiency is obtained at a 10 Hz frequency. The study of the effect of frequency on morphology showed that hydrogen evolution plays a significant role in the morphology formation of samples obtained at low pulse frequency (10 Hz), two processes of hydrogen evolution and anisotropic growth have key roles in morphology formation at medium pulse frequency (50 Hz) and anisotropic growth is the mechanism of morphology formation at high pulse frequency (100 Hz).
Introduction
Tellurium (Te) with intermediate properties of metals and nonmetals and an energy gap of 0.34 eV is an important valuable metalloid element. Because of its excellent optoelectronic and thermoelectric properties, Te is used extensively in metallurgy, photovoltaics, photonics, electronics, and medicine. For example, tellurium is added to various alloys to modify their properties (it is used in iron, copper, and lead alloys to make them more machinable). In the rubber industry, Te is used as an accelerator, in glasses Te is used as coloring matter and it is used as a brightener in electroplating baths [1-11].
Also, Te is a fundamental component of CdTe thin-film photovoltaic cells, and CdTe thin-film photovoltaic cells are one of the most common commercially available solar panels in demand. However, the abundance of tellurium in the earth's crust is very low (0.001–0.005 g·t−1), and generally, 90% of the Te is recovered as a byproduct of other processes [12].
Today the anode slime produced during the electrolytic refining of copper is considered a primary source of tellurium and treatment of 1000 tons of copper ore typically yields about 1 kg of tellurium. Other metals such as copper, selenium, nickel, tellurium, silver, gold, and a trace amount of platinum group metals are usually present in copper anode slimes with the Te content typically being about 1-4 wt%, and in some cases reaching as high as 8-9 wt% [13,14]. The United States, Peru, Japan, Russia, and Canada are countries that are leading in tellurium production. Global tellurium production is difficult to determine because not all companies or countries report their production [15]. Currently a sequence of pyrometallurgical or hydrometallurgical processes including acid leaching or alkaline leaching, purification, and electrodeposition preformation on the anode slime generated during the electrolytic refining of copper lead to the production of more than 90% of Te.
Numerous viable approaches including the chemical method, electrowinning, vacuum distillation, and zone melting have been developed to produce metallic Te. Among these techniques, because of their viability, efficiency, simplicity, and environmental protection, electrowinning is important in metallic Te production [16]. In the conventional electrowining technique either constant current or potential is applied to the electrode surface for tellurium production and no attention has been paid to the application of pulse current or potential [17]. However for other metals due to improvements in the mechanical and chemical properties of the deposit, the pulsed current electrodeposition has received much attention in recent years [18-20]. The advantages of pulsed plating are numerous, including reduction of porosity, lower gas content, high purity, fine-grained deposits, and low electrical resistance of deposits. Pulsed plating of alloys has proved beneficial as well and it is possible to produce harder, pore-free deposits by it.
In the present work, the deposition of tellurium on stainless steel was undertaken with the usage of square wave pulse current in an alkaline bath, and the effect of pulse parameters including duty cycle, frequency, and current density on current efficiency and morphology were studied.
Experimental details
NaOH (99.99%, Merck) and TeO2 (> 99%, Merck) used in the electrochemical experiments were of analytical grade. Solutions were prepared from TeO2 (2.06 gr) dissolved in 2.5 M NaOH solution. Cyclic Voltammetry (CV) and Linear Sweep Voltammetry (LSV) measurements were carried out by using an Electrochemical Analyser System Potentiostat/Galvanostat model: BHP 2066. Ag/AgCl electrode was used as reference electrode and all potentials in this work are quoted with respect to the Ag/AgCl reference electrode. A Pt disc electrode (0.031 cm2) was used as a working electrode and a Pt rod served as a counter electrode for cyclic voltammetry and polarization experiments.
Prior to each deposition, the steel substrates were given a galvanostatically electropolishing treatment at a current density of 0.5 A cm−2 for 5 min in a bath (70 °C) containing 50 vol.% phosphoric acid, 25 vol.% sulfuric acid, and balanced deionized water.
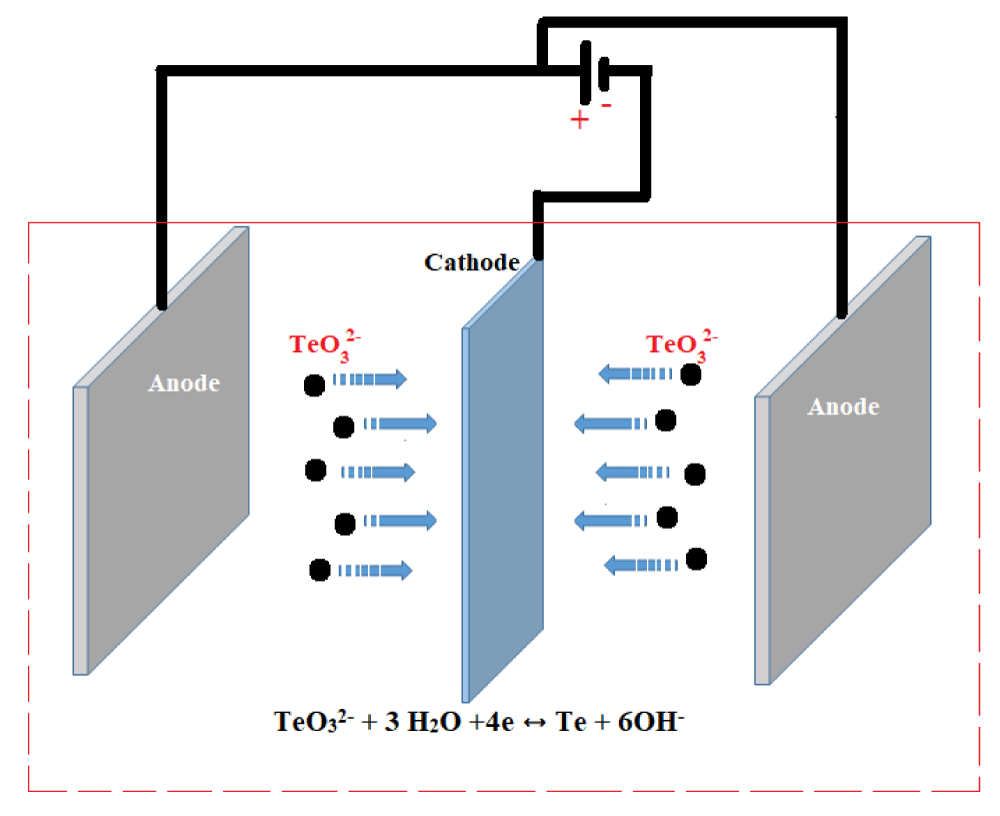
The electrochemical cell for electrodeposition included the cathodic substrate centered between two co-planar stainless counter electrodes (Scheme 1).
Tellurium was deposited directly on both sides of the stainless steel cathode (316 L, 20 × 30 × 0.5 mm3) under a pulsed galvanostatic mode at a cathode current density of 7.5, 15 and 30 mA cm-2 and duty cycle of 10%, 25%, 50% and 75% and frequency of 10, 50 and 100 Hz.
The electrodeposition bath was an aqueous solution which was fixed at room temperature. After electrodeposition, the deposited film was rinsed several times in deionized water and dried at room temperature for 48 h. Thereafter, the as-deposited sample was scraped from the steel electrode and subjected to further analysis.
Results and discussion
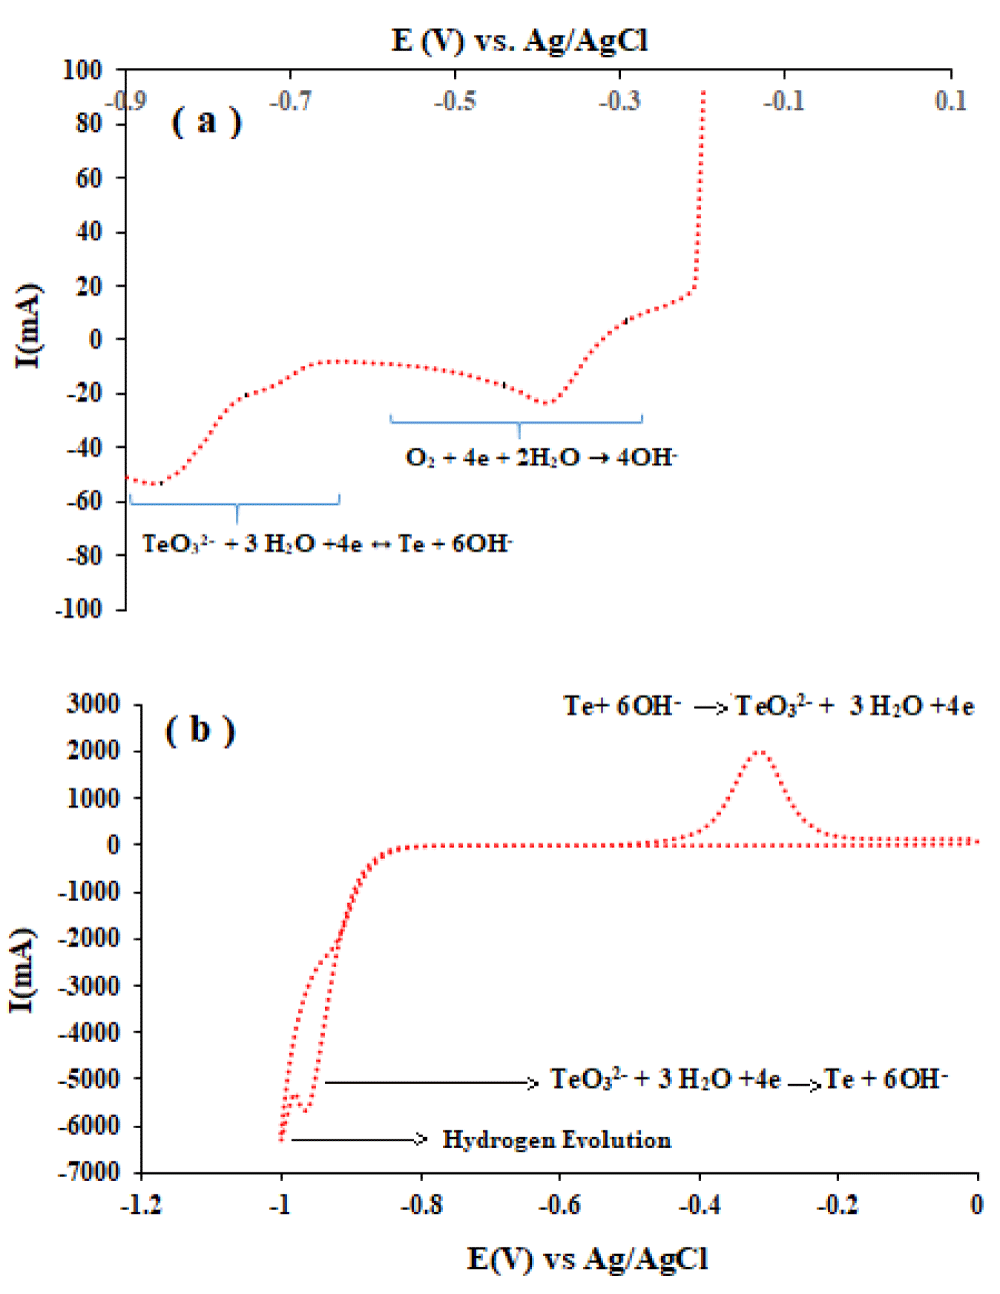
Cathodic polarization and Cyclic voltammetry: For the study of the electrochemical behavior of tellurium ions in alkaline medial, the linear sweep voltammetry (LSV) curve was obtained from Te solution (in 2.5 M NaOH ) by Pt electrode with a scan rate of 1 mVs-1 at the potential range from −0.2 V to −0.9 V (Figure 1a).
Three stepwise reductions to Te0, Te22- and Te2- (equations 1, 2, and 3) can be considered for tellurite ion (TeO32-) in alkaline media according to the Pourbaix diagram [21].
TeO32- + 3 H2O +4e ↔ Te + 6OH- E0 = -0.533 V (1)
2Te + 2e ↔ 2Te2- E0 = -0.827 V (2)
2Te2- + 2e ↔ Te22- E0 = -1.432 V (3)
The first current plateau at about -0.4 V is the limiting current for the reduction of dissolved oxygen. As the potential shifted negatively and reached about -0.70 V, current density increased and the reduction of TeO32- to Te0 occurred. With the more negative shifting of potential, the reduction reaction of Te0 to Te2-2 and hydrogen evolution led to increasing current and breakdown of deposited Te [21].
Also before electrochemical deposition, to further study the electrochemical behavior of tellurium, cyclic voltammetry (CV) measurements by Pt disc electrode between 0 and -1V were carried out (Figure 1b). The nucleation and growth process or phase formation and growth of tellurium on the Pt electrode can be approved by the crossover between the cathodic and the anodic scans. This behaviour can be found in the electrodeposition of other metals on different substrates [21]. In summary, the curve exhibited two cathodic peaks and one anodic peak. As can be seen during the cathodic scan, the nucleation over the potential for the reduction of tellurite on Pt was about -0.85 V, and the current increases sharply after the formation of the nuclei. However, this observed peak can be attributed to the mixing of reduction reactions of the TeO32- to Te, Te(s) to Te2− ion, and Te(s) to Te22− ion [22]. It must be mentioned that the very weak cathodic peak at about -0.2 V (which was not shown here but was clear in LSV) can be identified with the reduction of the dissolved oxygen. The anodic peak at about -0.3 V correlated with the oxidation of the electrodeposited Te formed in the course of the cathodic reduction process [22].
Effect of current density on current efficiency and morphology
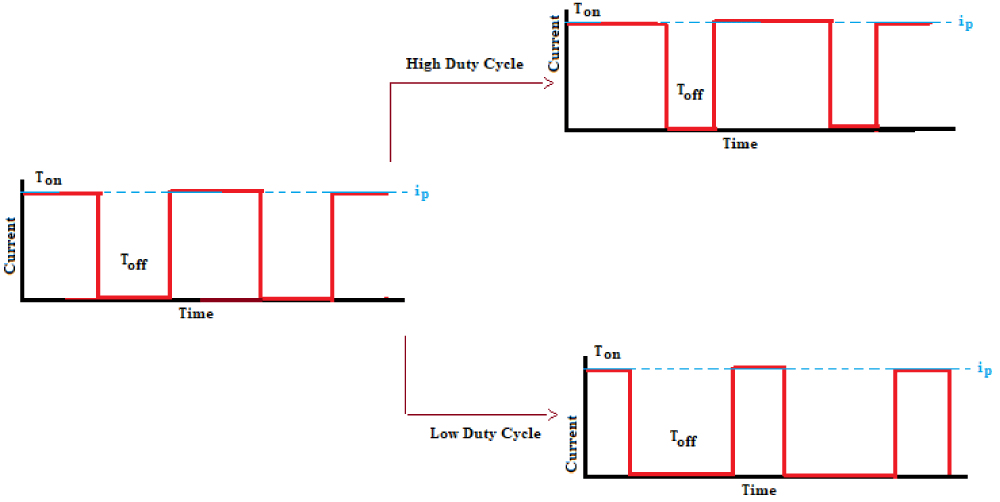
In DC electrodeposition mode the current is applied in a total period of deposition while in pulse electrodeposition mode the current is switched on and off during the deposition period. Figure 2 shows a unipolar waveform with pulse parameters including duty cycle, peak current density, etc. Several variables can influence deposit properties present in a simple pulse current wave-form. The period of time that the peak current is applied is defined as the pulse on time, Ton, whilst the pulse off time, Toff, is the period of time when the current is off. Total pulse period, Tp is the sum of Ton and Toff.
The relation between the parameters of duty cycle, γ, frequency, ƒ, and Tp are as follows:
ƒ=1/Tp (5)
Peak current density, ip, is the current imposed during the on-time. The average current density for the entire pulse cycle, iave, is given by:
iave = ipγ (6)
In practice, for any simple unipolar pulse deposition process, one needs to choose three independent parameters, Tp, γ, and ip. In high-value duty cycles the mass flux for a pulse deposition process is close to the DC current condition. During the application of a current pulse, when the current is switched on the concentration boundary layer forms and it relaxes as the current is switched off. A dual diffusion layer is applied for the description of mass transfer during pulse deposition [23–25]. The dual diffusion layer consists of a pulsating inner diffusion layer and a stagnant outer diffusion layer. The inner diffusion layer is influenced by pure diffusion and the off time, whilst the outer stagnant diffusion layer controls the overall plating which cannot exceed that obtained by DC plating [26,27].
In the current work, the choice of pulse parameter (γ, ip, and ƒ) values was based on the DC electrodeposition of tellurium and pulse deposition of other metals. The ip values were 7.5, 15, and 30 mAcm-2, the γ values were 10, 25, 50, and 75% and the ƒ values were 10, 50, and 100 Hz.
The current efficiency (%) was calculated according to Eq. (7).
Where m represents the mass of Te deposits (g), n is the electron number, F is the Faraday number (C·mol−1), M is the molecular weight (g·mol−1), I is the applied current (A) and t is the deposition time (h).
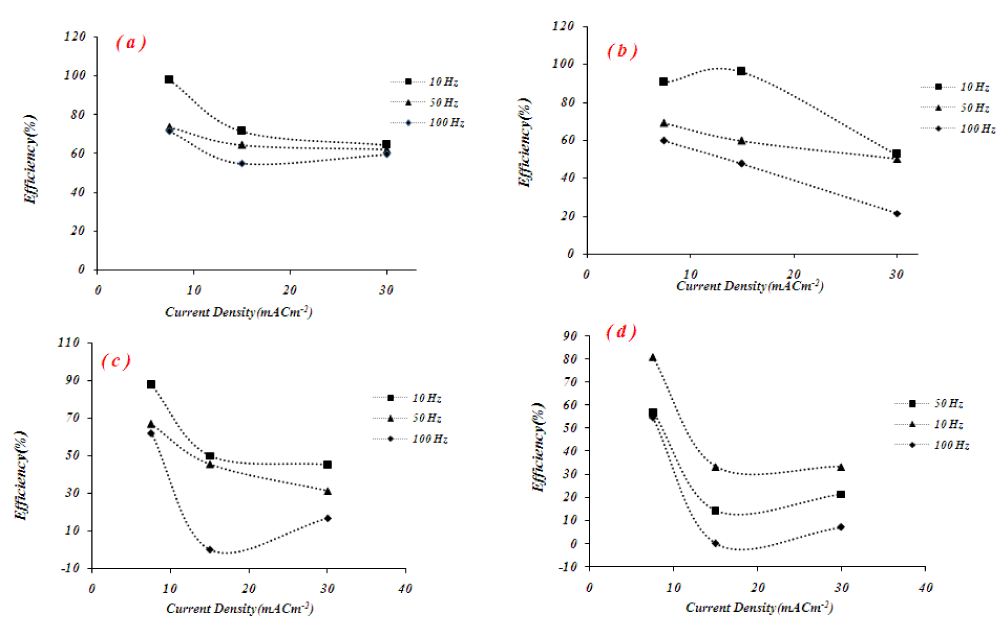
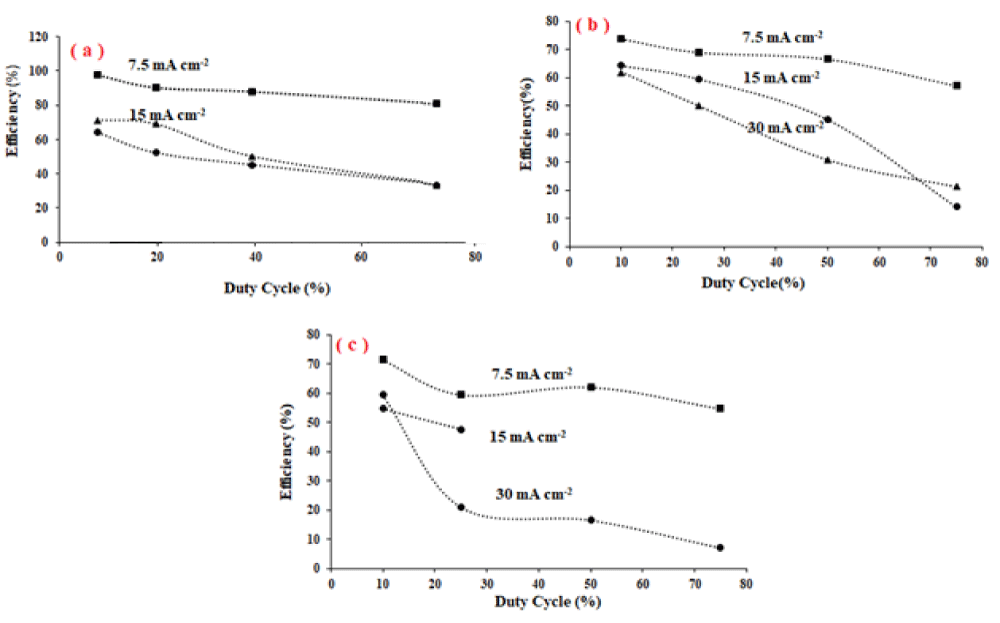
Figure 3 shows the effect of current density on current efficiency at different duty cycles for the electrodeposition of tellurium. As can be seen, the current efficiency decreased with increasing current density. The possible reasons for this result are the increased water reduction and hydrogen evaluation at higher current density. In other words, with current density increasing more value of current was consumed by the water reduction reaction and this led to a decrease in current efficiency. When the current density is low, the probability of hydrogen evolution reaction is negligible. The hydrogen evolution reaction is an inherent process in electroplating. As the current density exceeds 30 mA cm2-, hydrogen evolution becomes violent resulting in a reduced metal deposition.
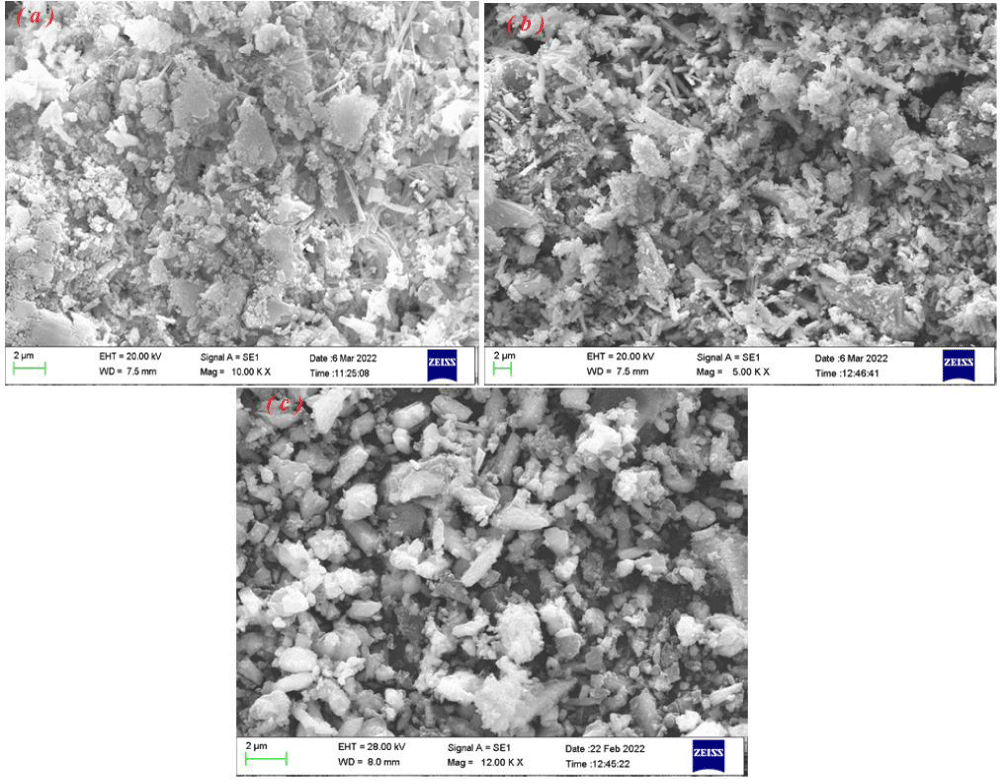
The morphologies of the as-prepared samples (scrapid) at different current densities (7.5, 15, and 30 mA cm-2) at 100 Hz frequency and 10 %duty cycle are investigated by SEM (Figure 4a-c).
The results indicated that the morphology of the sample synthesized at various current densities is different. The close images analysis showed that more compact structures were observed for the electrodeposits at lower current densities, with lower porosity values, as seen in Figure 3a,b. As the current density increased, the porosity increased significantly due to the evolution of hydrogen gas at the cathode, and the resultant morphology was less compact. The cracked surface tends to nano-particle with increasing current density. The sample synthesized at a current density of 30 mA cm-2 contains clear uniform semi-rod nanostructures. It seems that the deposit growth among the H2 bubbles and escape H2 bubbles make a unique porose structure with various morphology. At high current density, the rate of hydrogen evolution is increased and the pressure resulting from the bubbles on the deposit to growth is increased so the directory (well condition for one-dimensional particles formation) is high while at low current density, the rate of hydrogen evolution is decreased and the pressure resulting from the bubbles on the deposit to growth is decreased and the condition is well for compact structural formation.
Effect of duty cycle on current efficiency and morphology
Figure 5, shows the current efficiency of tellurium extraction at duty cycles of 10%, 25%, 50%, and 75% at three different current densities. It has been found that the current efficiency of tellurium plating decreases as the pulse duty cycle increases from 10% to 75%. Maximum current efficiency has been observed at a 10% duty cycle and frequency of 10 Hz at a peak current density of 7.5 mA cm-2. The current efficiency is lower at higher frequencies and current densities. This may be attributed to the evolution of hydrogen at the cathode during plating.
During pulse electrodeposition, as the value of the duty cycle became larger, the current off time was reduced, and the current on time was increased during plating. When the current is on, the tellurium ions are reduced at the electrode surface, and the surface of the electrode depletes from TO32- ions, when the current is off, the electrode surface is well replenished with TO32- ions and the forward deposition rate becomes faster. Crystal growth and nucleation in on and off current times are different. When the current is on, the nucleation process overcomes crystal growth and when the current is off, the crystal growth is faster than nucleation. Also when the current is off, the solvent molecules reduction is stopped, hydrogen evolution vanishes and the splashing of deposit into solution is reduced.
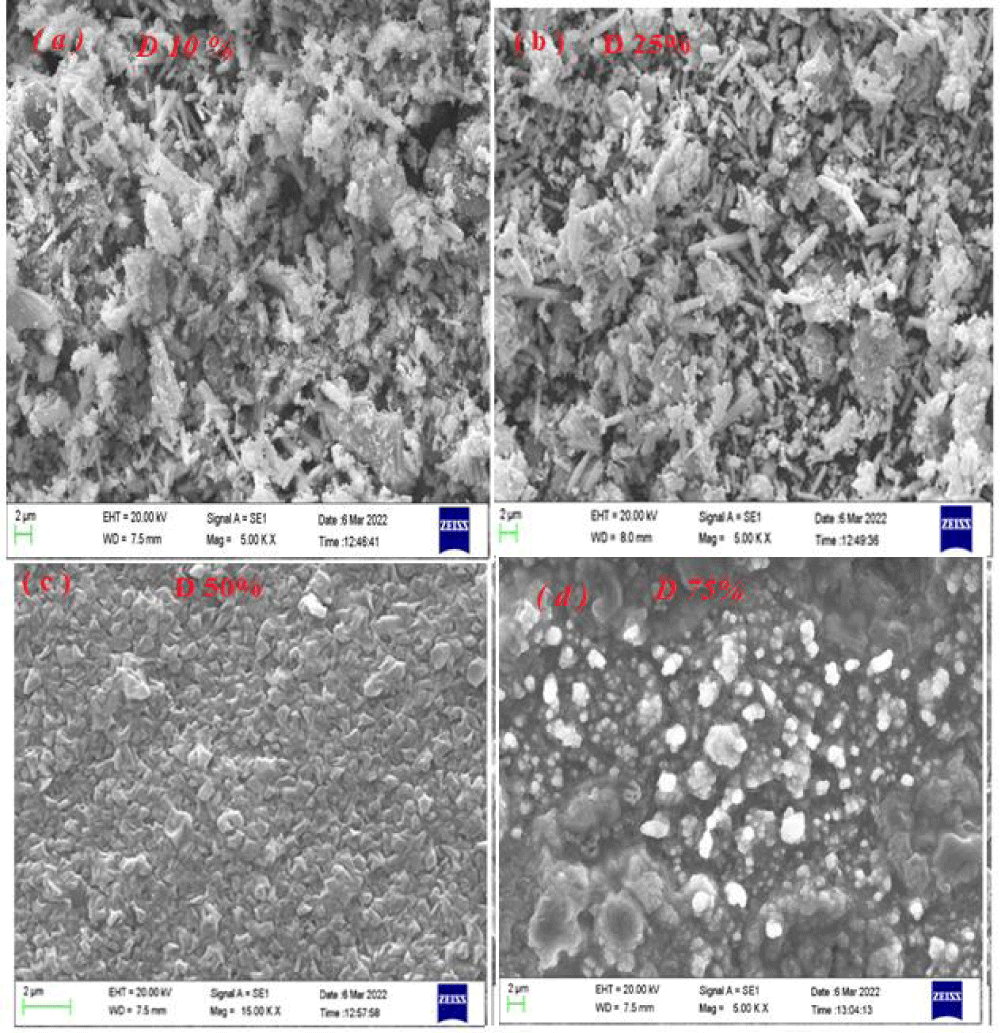
Figures 6a-d show the morphology of tellurium samples synthesized at different duty cycles of 10%, 25%, 50%, and 75% (with a current density of 15 mAcm-2 and frequency of 100 Hz).
The images show the samples synthesized at duty cycles of 10% and 25% have approximately similar appearance (particle shape) and the particle size in the two samples are the same. In other words, the morphology of two samples contains irregular and random nanoparticles as well as nanorods with a diameter range of 20 nm - 100 nm. The nanorods and nanoparticles with different sizes are distributed in samples and agglomeration or entanglement of small structures leads to larger particles formation. With more increasing of duty cycles to 50 and 75% (Figure 6c-d), the current on-time contribution will be increased and more reduction reactions take place at the electrode surface. In other words with increasing duty cycles the rate of hydrogen evolution at the electrode surface is significant and H2 bubbling is effective in morphology formation. And emersion of uniform morphology with narrow distribution size will be more possible at a higher duty cycle (as can be seen with an increased duty cycle from 50% to 75% the formation of particles is more complete). While at low-duty cycles the contribution of current on time is reduced and hydrogen evolution has a slight role in morphology formation. Since there was no catalyst or template involved in the synthesis process at a low-duty cycle, it was reasonable to derive the driving force for the anisotropic growth of the tellurium nanoparticles and nanorods from the inherent structure of the tellurium crystal and its chemical potential in solution. The tellurium nanoparticles formation and gradual transformation of nanoparticles into nanorods could be attributed to their one-dimensional growth and anisotropic nature. Such mechanisms follow the well-known ‘‘Ostwald Ripening’’ process, in which larger nanoparticles grow at the expense of smaller ones because of differences in their surface energies. In summary, the morphology formation at different duty cycles based on hydrogen evolution (at high duty cycle) and anisotropic growth (at low duty cycle) were explainable.
Effect of pulse frequency on current efficiency and morphology
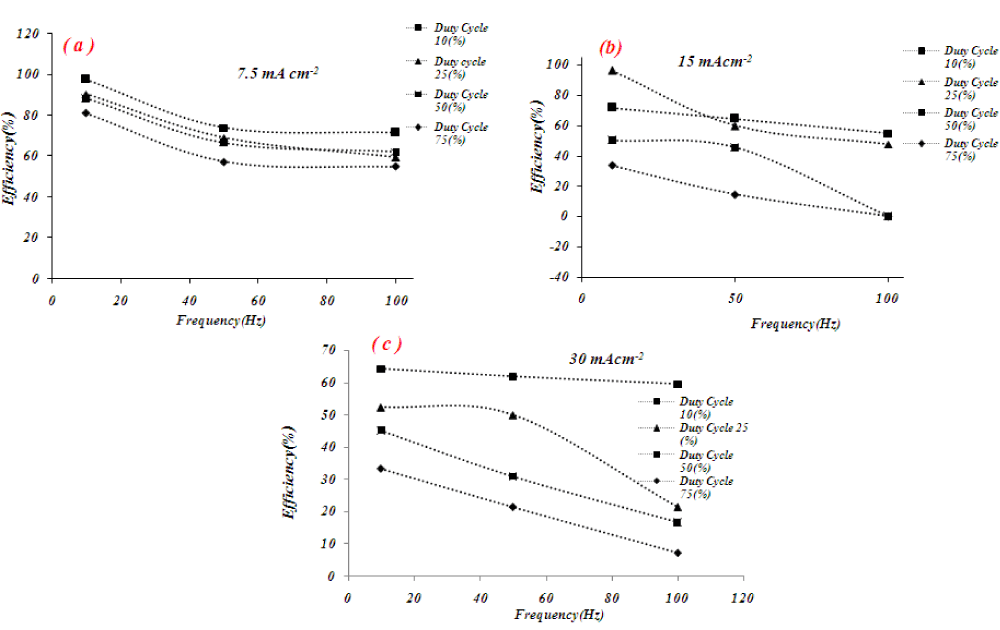
Figure 7 shows the effect of the frequency on the current efficiency of tellurium which is electrolytically deposited under 10 Hz, 50 Hz, and 100 Hz pulse frequency and duty cycle of 10%.
The current efficiency of the deposit tellurium exhibited a strong dependence on the frequency and current density. As frequency increases, the current efficiency almost decreases. In most cases, the maximum current efficiency is obtained at a 10 Hz frequency. The possible reason for these results is as frequency is increased, the on-time contribution of current is decreased and the electrochemical reaction is incomplete. Also during short pulses (small duty cycle), the concentration of tellurium ions in the electrode surface is high and solvent reduction has a negligible effect on current efficiency.
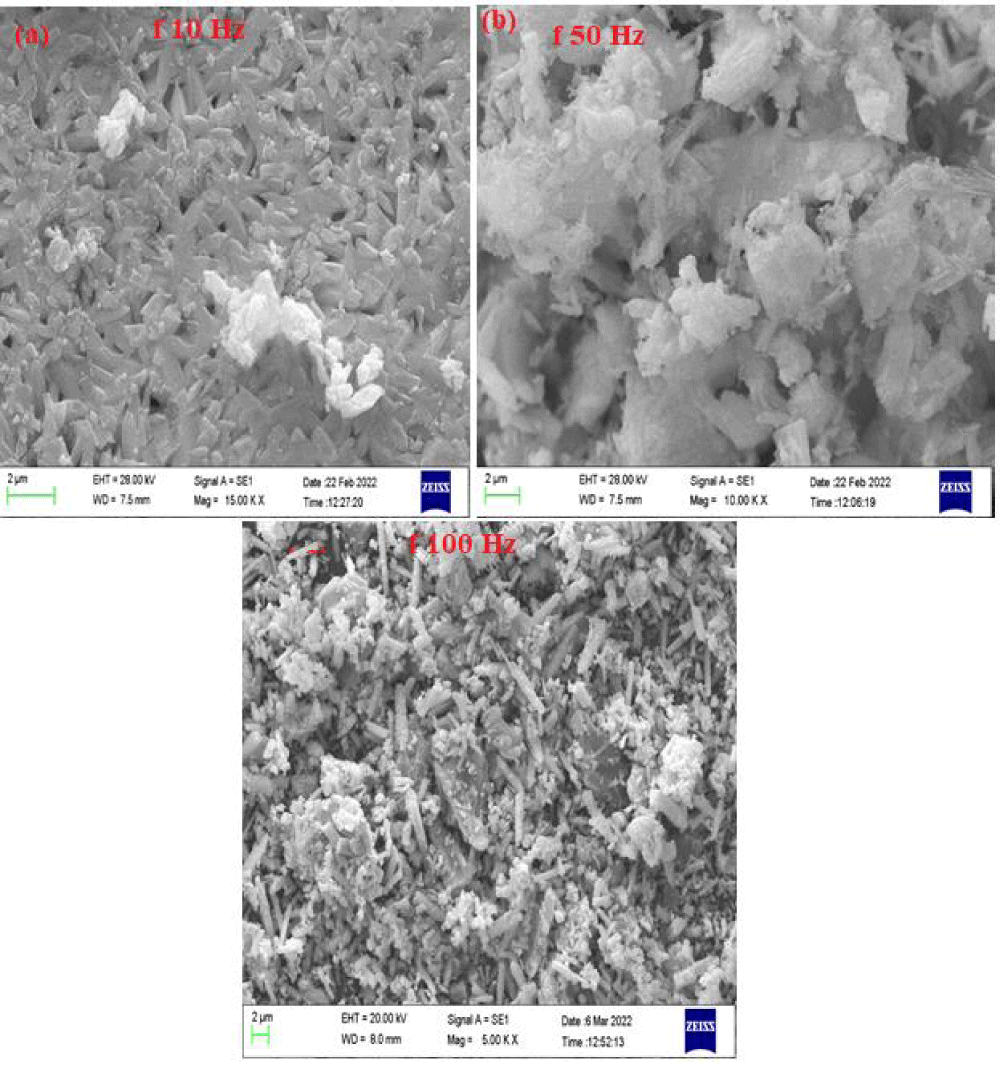
Figure 8 shows the SEM images of tellurium samples synthesized under 10 Hz, 50 Hz, and 100 Hz pulse frequencies at fixed current density (15 mAcm-2) and fixed duty cycle (25%). The sample obtained at 10 Hz frequency (Figure 7a) exhibits well-ordered wheat seed-like morphology while the samples obtained under 50 and 100 Hz pulse frequency (Figures 7b,7c) have irregular and randomly morphology, which is consistent with the above description as pulse frequency increases, the on-time current decreases and the concentration of tellurium ions in electrode surface is high and water reduction (hydrogen evolution) has negligible effect on morphology. Close examination clears that anisotropic growth in a sample obtained at a pulse frequency of 100 Hz is greater than the sample obtained at 50 Hz. In other words, as pulse frequency increases the current period decreases and the role of hydrogen evolution in morphology formation is eliminated and anisotropic growth becomes significant. Therefore the sample obtained at a low pulse frequency is well ordered and has uniform morphology (due to hydrogen evolution) while the samples obtained at a higher pulse frequency are more random and have anisotropic morphology (absent of hydrogen evolution). In fact, hydrogen evolution has a significant role in the morphology formation of samples obtained at low pulse frequency (10 Hz), and two processes of hydrogen evolution and anisotropic growth attributed to morphology formation in samples obtained at medium pulse frequency (50 Hz) and anisotropic growth is the mechanism of morphology formation at sample obtained at high pulse frequency (100 Hz).
Pulse electrowinning in anode copper slime sample
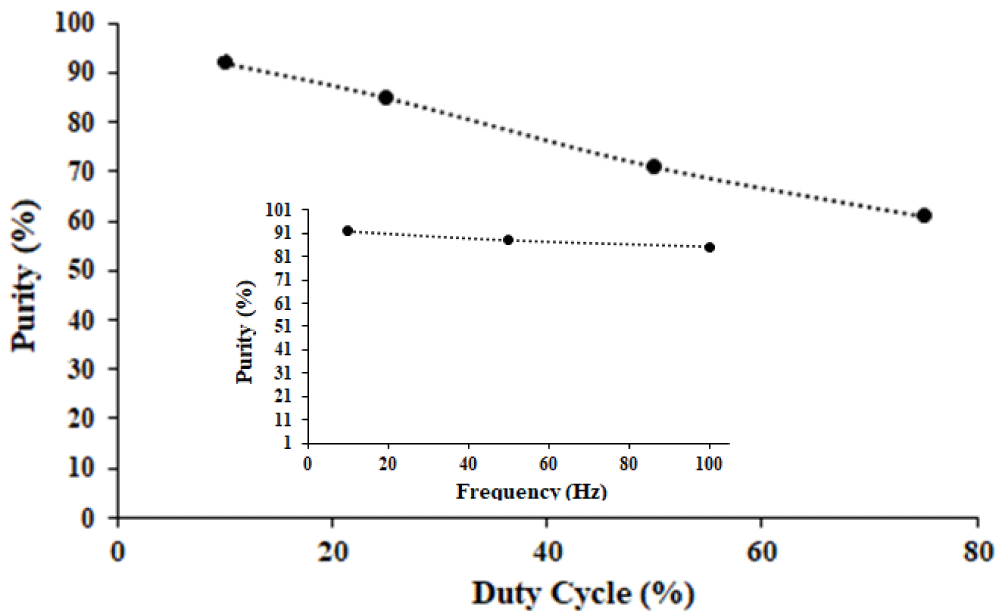
In order to investigate pulsed electrowinning in real copper anode slime, a sample was simulated based on the chemical analysis of copper anode slime. Thus 2 × 10⁻³ gr Cu, and 0.111 gr Se were added to 0.13 M tellurium solution, and pulse electrowinning at an optimized current density of 7.5 mAcm-2 and various duty cycles and frequencies was conducted. The purity of samples was determined by EDS. Figure 9 shows the product purity of extracted tellurium from simulated samples at different duty cycle % and Frequency (Hz). The results indicated that with increasing duty cycle the purity of the product decreased and the value of Cu and Se in the sample increased. In high duty cycle %, the current on period increased and more current is available for side reactions such as Cu and Se reduction. Therefore more Cu and Se are present in deposits obtained at higher duty cycle % compared with the samples obtained at lower duty cycle. Figure 9(inset) shows the effect of frequency on the purity of obtained samples at a duty cycle of 10%. As can be seen, it is clear that frequency variation has a slight effect on the purity of samples.
Conclusion
Tellurium samples have been successfully electroplated from the alkaline bath by pulse cathodic electrodeposition on a stainless steel electrode. Before the electrochemical deposition of tellurium was conducted, Cyclic Voltammetry (CV) measurements by Pt disc electrode between 0 and -1V to study the electrochemical behavior of tellurite were carried out. The effect of parameters including current density, duty cycle, and frequency on current efficiency and morphology were studied. The results indicated that the current efficiency of electro-plating decreased with increasing current density and more compact and uniform samples were obtained at lower current densities (about 7.5 mA cm-2), particle shape, and porous sample at higher current density. It has been found that the current efficiency of tellurium plating decreases as the pulse duty cycle increases from 10% to 75% and the morphology of the samples synthesized at a duty cycle of 10% and 25 % are the same while at higher duty cycles the morphology changed. The current efficiency of the deposit tellurium exhibited a strong dependence on the frequency. The result cleared that maximum current efficiency has been observed at 10% duty cycle, 10 Hz frequency, and current density of 7.5 mAcm-2. The morphology formation at different frequencies, based on hydrogen evolution, and anisotropic growth were discussed.
- Mehrabian M, Noroozian E, Maghsoudi Sh. Preparation and application of Fe3O4@SiO2@poly(o-phenylenediamine) nanoparticles as a novel magnetic sorbent for the solid-phase extraction of tellurium in water samples and its determination by ET-AAS. Microchem J. 2021; 165:106104.
- Babula P, Adam V, Opatrilova R, Zehnalek J, Havel L, Kizek R. Uncommon heavy metals, metalloids and their plant toxicity: a review. Environ Chem Lett. 2008 Dec; 6(4):189-213.
- U.S. Geological Survey. Mineral commodity summaries 2018. Reston: U.S. Geological Survey; 2018; 200.
- Hofmann JE. Recovering selenium and tellurium from copper refinery slimes. JOM. 1989 Jul; 41(7):33-38.
- Fthenakis VM. End-of-life management and recycling of PV modules. Energy Policy. 2000 Oct; 28(14):1051-1058.
- Feltrin A, Freundlich A. Material considerations for terawatt level deployment of photovoltaics. Renew Energy. 2008 Feb; 33(2):180-185.
- Kavlak G, Graedel TE. Global anthropogenic tellurium cycles for 1940–2010. Resour Conserv Recycl. 2013 Jan; 76:21-26.
- Aspiala M, Taskinen P. Thermodynamic study of the Ag–Sb–Te system with an advanced EMF method. J Chem Thermodyn. 2016 Jun; 93:261-266.
- Murray CB, Norris DJ, Bawendi MG. Synthesis and characterization of nearly monodisperse CdE (E=sulfur, selenium, tellurium) semiconductor nanocrystallites. J Am Chem Soc. 1993 May; 115(19):8706-8715.
- Tang G, Qian Q, Wen X, Zhou G, Chen X, Sun M, Chen D, Yang Z. Phosphate glass-clad tellurium semiconductor core optical fibers. J Alloy Compd. 2015 Jan; 633:1-4.
- Rellick JR, McMahon CJ, Marcus HL, Palmberg PW. The effect of tellurium on intergranular cohesion in iron. Metall Mater Trans B. 1971 May; 2(5):1492-1494.
- Hong J, Xu Z, Xu D, Guo X, Liu D, Tian Q. A pilot study: Efficient electrowinning of tellurium from alkaline solution by cyclone electrowinning technology. Hydrometallurgy. 2020 Nov; 196:105429.
- Xu L, Xiong Y, Zhang G, Zhang F, Yang Y, Hu Z, Tian Y, You J, Zhao Z. An environmental-friendly process for recovery of tellurium and copper from copper telluride. J Clean Prod. 2020 Dec; 272:122723.
- Moats M, Robinson T, Davenport W, Karcas G, Demetrio S. Electrolytic copper refining-2007 world tankhouse operating data. In: Copper-Cobre 2007 International Conference. 2007; 195-242.
- Fan Y, Yang Y, Xiao Y, Zhao Z, Lei Y. Recovery of tellurium from high tellurium-bearing materials by alkaline pressure leaching process: Thermodynamic evaluation and experimental study. Hydrometallurgy. 2013 Mar; 139:95-99.
- Tian Q, Li J, Guo X, Li D, Yang Y, Xu Z, Li W. Efficient Electrochemical Recovery of Tellurium from Spent Electrolytes by Cyclone Electrowinning. J Sustain Metall. 2021 Mar; 7:27-45.
- Zhong J, Wang G, Fan J, Li Q, Kiani M, Zhang J, Yang H, Chen J, Wang R. Optimization of process on electrodeposition of 4N tellurium from alkaline leaching solutions. Hydrometallurgy. 2018 Jan; 176:17-25.
- Shanthi C, Barathan S, Jaiswal R, Arunachalam RM, Mohan S. The effect of pulse parameters in electro deposition of silver alloy. Mater Lett. 2008 Dec; 62:4519-4521.
- Tsai WC, Wan CC, Wang YY. Mechanism of copper electrodeposition by pulse current and its relation to current efficiency. J Appl Electrochem. 2002 Dec; 32:1371-1378.
- Fan Y, He Y, Luo P, Shi T, Chen X. Pulse Current Electrodeposition and Properties of Ni-W-GO Composite Coatings. J Electrochem Soc. 2016 Feb; 163(3).
- Ha YC, Sohn HJ, Jeong GJ, Lee CK, Rhee KI. Electrowinning of tellurium from alkaline leach liquor of cemented Te. J Appl Electrochem. 2000 Mar; 30: 315-322.
- Xu Z, Guo X, Tian Q, Li D, Zhang Z, Zhu L. Electrodeposition of tellurium from alkaline solution by cyclone electrowinning. Hydrometallurgy. 2020 Dec; 193:105316.
- Ibl N. Some theoretical aspects of pulse electrolysis. Surf Technol. 1980; 10:81-104.
- Landolt D, Datta M. Experimental investigation of mass transport in pulse plating. Surf Technol. 1985; 25:97-110.
- Roy S. Mass transfer consideration during pulse plating. Trans IMF. 2008; 86(2):87-91.
- Cheh HY. Electrodeposition of gold by pulsed current. J Electrochem Soc. 1971; 118:551-557.
- Chin DT. Mass transfer and current-potential relation in pulse electrolysis. J Electrochem Soc. 1983; 130:1657-1667.
Article Alerts
Subscribe to our articles alerts and stay tuned.
 This work is licensed under a Creative Commons Attribution 4.0 International License.


 Save to Mendeley
